Make graphs from screenshots with Claude
 Peter Hartree
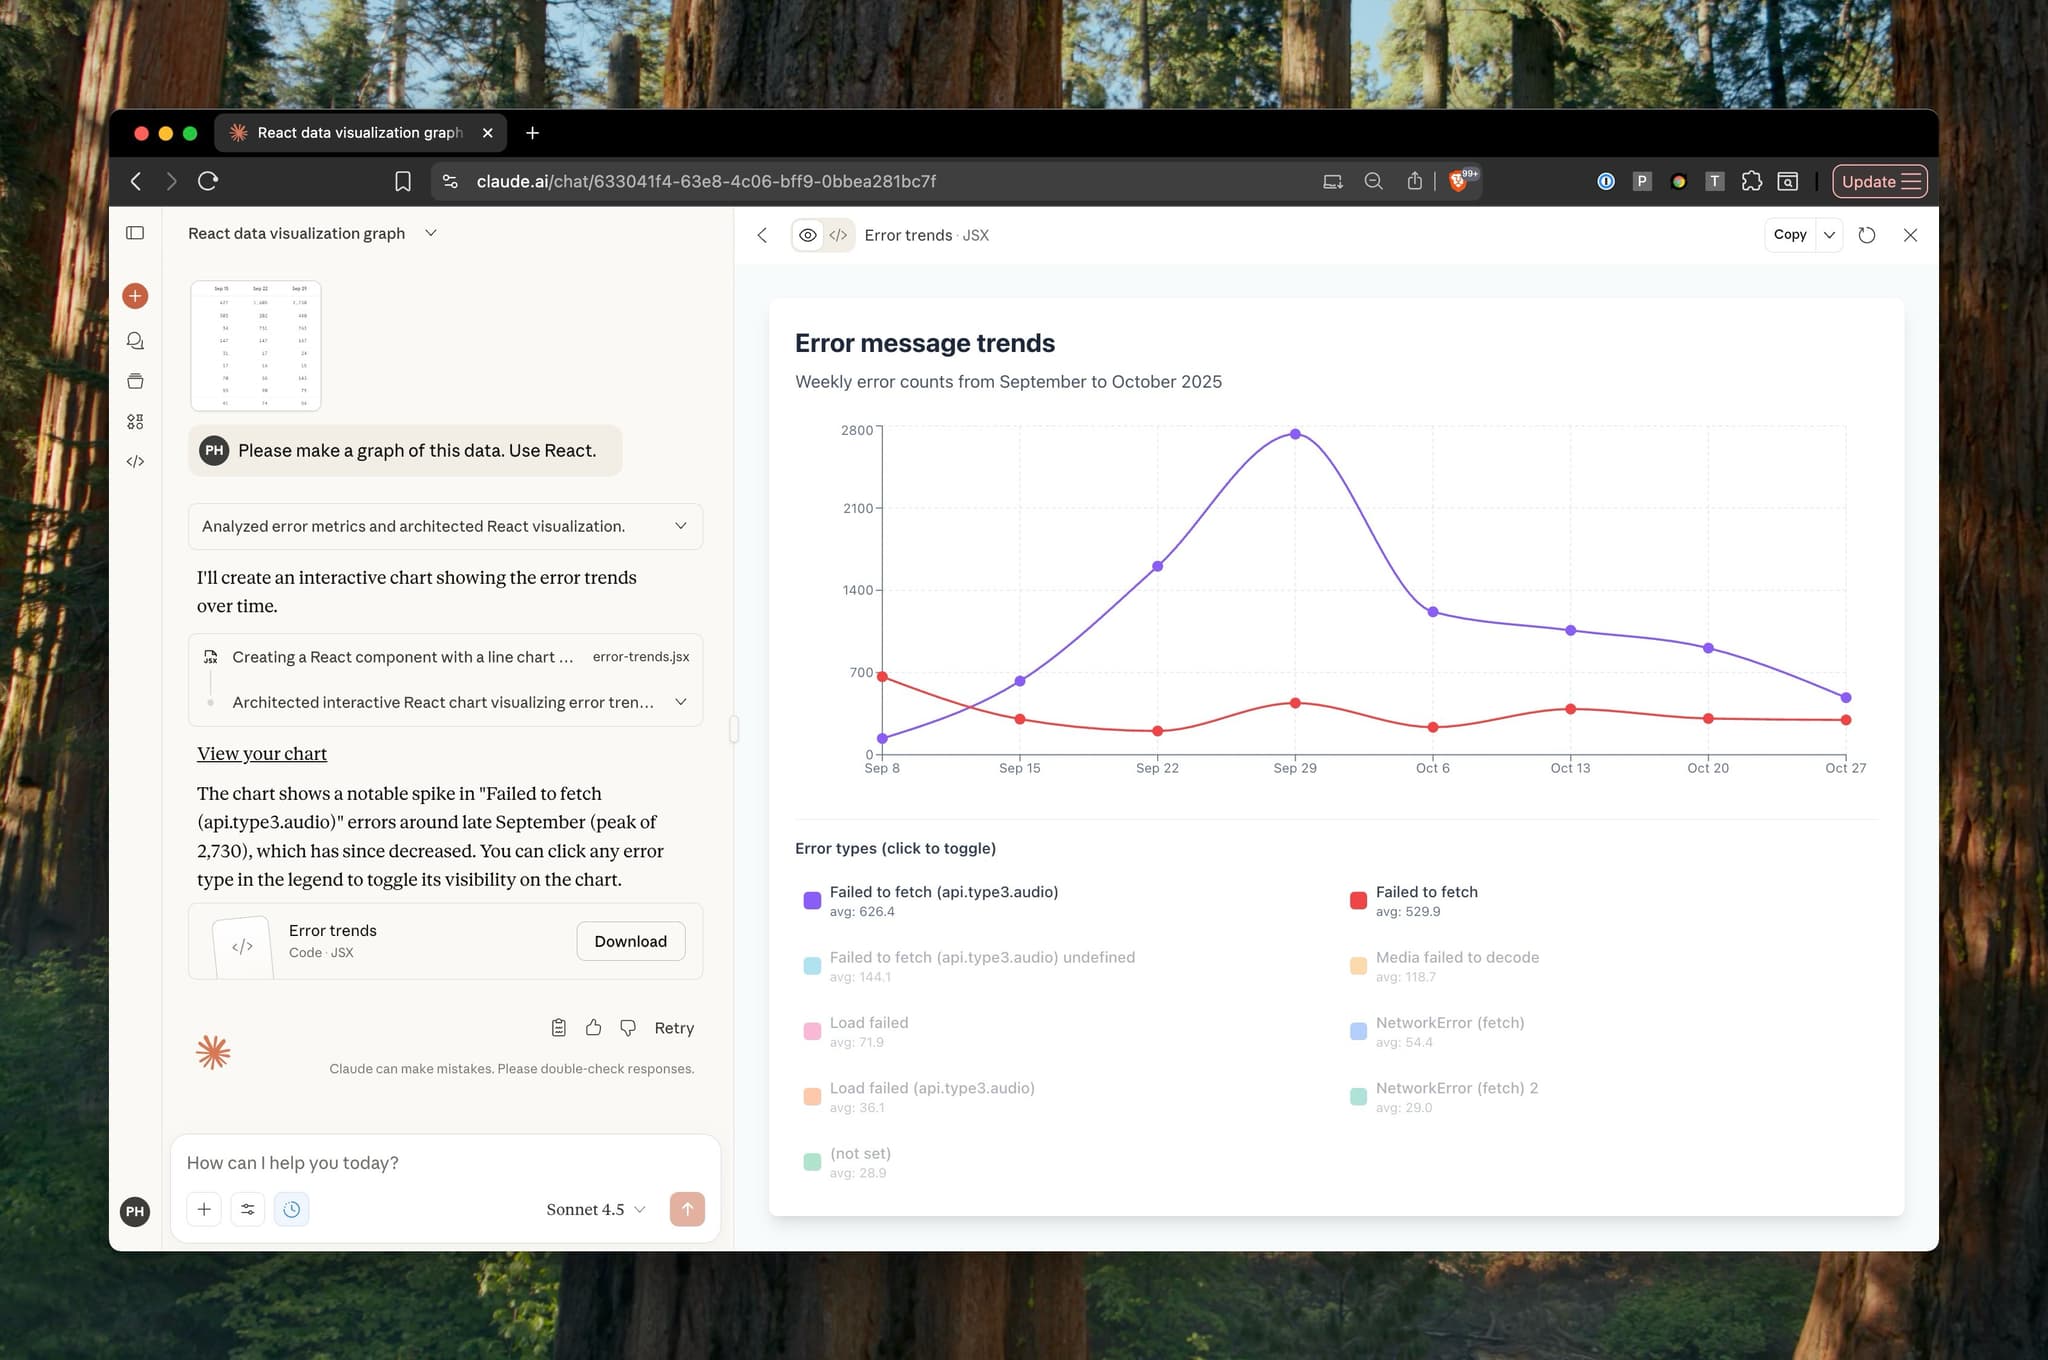
You can take a screenshot of some data, and ask Claude to make a graph.
This can be much faster than e.g. exporting a CSV from Mixpanel, importing to Google Sheets, then making a graph there.
In fact, I often use Claude to make graphs from data that's already in a Google Sheet. Reasons:
Claude makes better looking graphs, with good formatting choices (e.g. informative subtitles).
It often makes the graphs interactive in useful ways. Sometimes it's nice to paste a screenshot of the Claude graph into a Slack discussion or Google Doc report, and link to the interactive artifact.
Using Sonnet 4.5, it typically takes 5-15 seconds. For me, that's roughly as quick as making a decent graph in Google Sheets.
Say "Use React" in your prompt to force Claude to make an interactive Artifact. Without that, it'll sometimes decide to make a rather ugly graph using Python.

I've never seen OCR mistakes or hallucinations. My datasets always contain less than 100 cells. For larger datasets, I'd cross-check carefully (or just upload a CSV rather than a screenshot).
If you have particular requirements or style preferences for your graphs, tell Claude (once) by defining a Claude Skill.
ChatGPT and Gemini can do this too, but their graphs are ugly, and their defaults worse.
